- تحليلات
- التحليل الفني للسوق
Ford Motor التحليل الفني - Ford Motor التداول: 2024-12-17
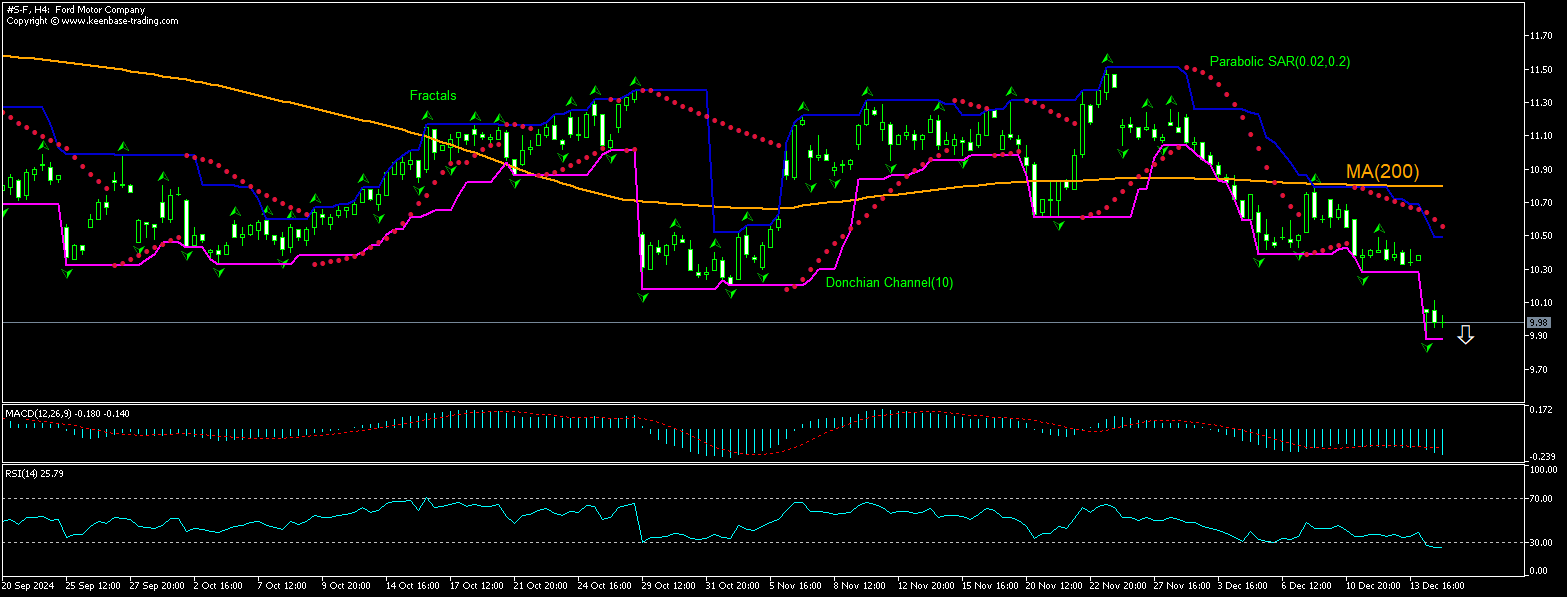
Ford Motor ملخص التحليل الفني
أقل من 9.88
Sell Stop
أعلى من 10.55
Stop Loss
| مؤشر | الإشارة |
| RSI | شراء |
| MACD | بيع |
| Donchian Channel | محايد |
| MA(200) | بيع |
| Fractals | بيع |
| Parabolic SAR | بيع |
Ford Motor تحليل الرسم البياني
Ford Motor التحليل الفني
The technical analysis of the Ford stock price chart on 4-hour timeframe shows #S-F,H4 is retreating under the 200-period moving average MA(200) after returning below MA(200) following a rebound to five-month high five weeks ago. RSI has entered the oversold zone. We believe the bearish momentum will continue after the price breaches below the lower boundary of Donchian channel at 9.88. This level can be used as an entry point for placing a pending order to sell. The stop loss can be placed above 10.55. After placing the order, the stop loss is to be moved every day to the next fractal high indicator, following Parabolic indicator signals. Thus, we are changing the expected profit/loss ratio to the breakeven point. If the price meets the stop loss level (10.55) without reaching the order (9.88), we recommend cancelling the order: the market has undergone internal changes which were not taken into account.
التحليل الأساسي لـ الأسهم - Ford Motor
Ford Motor company stock fell after Jefferies downgraded the American carmaker to "underperform" from "hold". Will the Ford stock price continue retreating?
Ford Motor Company stock closed 3.85% lower on the day yesterday after Jefferies downgraded the carmaker to "underperform" from "hold" and cut its price target on Ford to $9 from $12. Jeffries noted it was concerned over inventory build-up, strategic uncertainty in Europe, and a widening gap between warranty provisions and cash outflows. Ford’s US inventory levels have risen to 96 days in November. Jeffries wrote while Ford’s balance sheet is "robust," the potential restructuring and warranty claims could constrain cash available for shareholders due to a cumulative $8.5 billion gap between warranty provisions and cash outflows since 2020. A downgrade by an investment banking company is bearish for a company stock price.
:تنبيه
يحمل هذا الموجز طابعاً إعلامياً و تعليمياً و تنشر بالمجان . تأتي معظم البيانات المدرجة في الموجز من المصادر العامة معترفة أكثر و أقل موثوقية . مع ذلك ، لا يوجد تأكيد على أن المعلومات المشارة إليها كاملة و دقيقة . لا يتم تحديث الموجز . معظم المعلومات في كل موجز ، تتضمن الرأي و المؤشرات و الرسوم البيانية و أي شيئ اخر وتقدم فقط لأغراض التعريف وليس المشورة المالية أو توصية . لا يمكن اعتبار النص باكماله أو أي جزء منه و أيضاً الرسوم البيانية كعرض لقيام بصفقة بأي اداة . آي إف سي ماركيتس وموظفيها ليست مسؤولة تحت أي ظرف من الظروف عن أي إجراء يتم اتخاذه من قبل شخص آخر أثناء أو بعد قراءة نظرة عامة .


