- تحليلات
- التحليل الفني للسوق
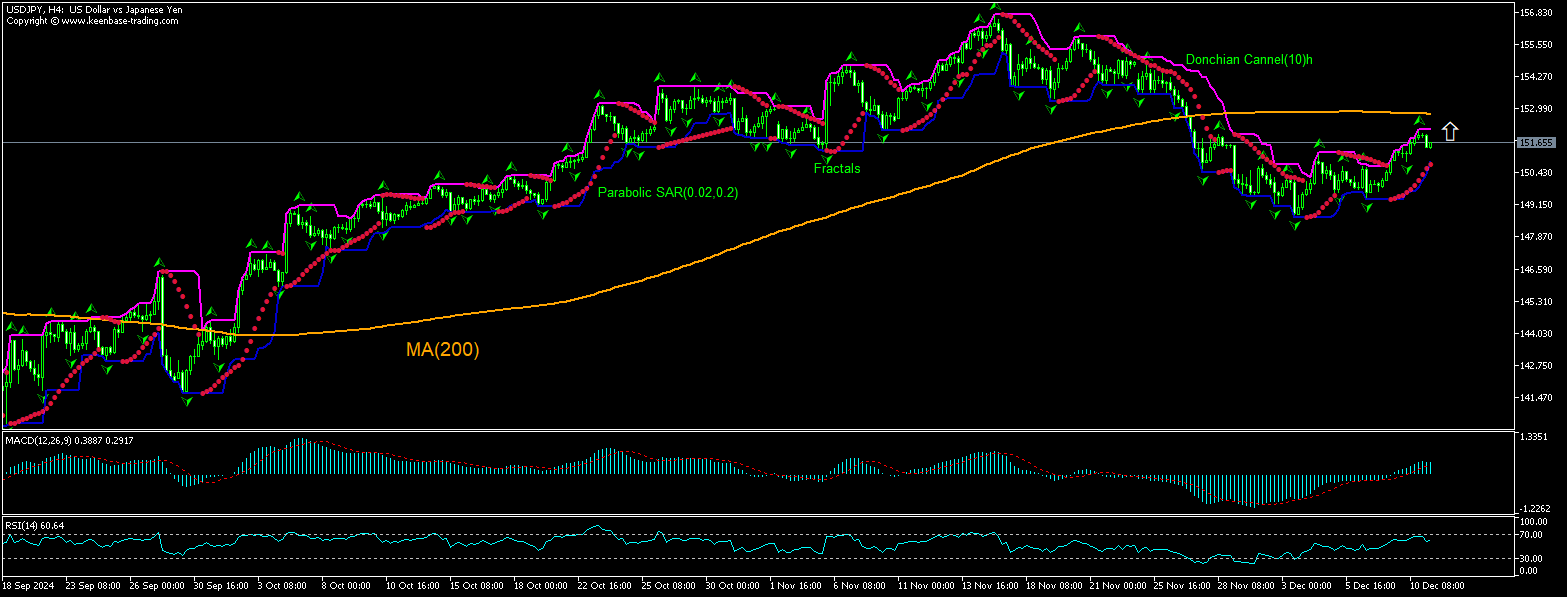
USD/JPY التحليل الفني - USD/JPY التداول: 2024-12-11
USD/JPY ملخص التحليل الفني
أعلى من 152.172
Buy Stop
أقل من 150.776
Stop Loss
| مؤشر | الإشارة |
| RSI | محايد |
| MACD | محايد |
| Donchian Channel | شراء |
| MA(200) | بيع |
| Fractals | شراء |
| Parabolic SAR | شراء |
USD/JPY تحليل الرسم البياني
USD/JPY التحليل الفني
The technical analysis of the USDJPY price chart on 4-hour timeframe shows USDJPY,H4 is rising to test the 200-period moving average MA(200) after hitting two-month low eight days ago. We believe the bullish movement will continue after the price breaches above the upper bound of the Donchian channel at 152.172. A level above this can be used as an entry point for placing a pending order to buy. The stop loss can be placed below 150.776. After placing the order, the stop loss is to be moved to the next fractals low, following Parabolic indicatorsignals. Thus, we are changing the expected profit/loss ratio to the breakeven point. If the price meets the stop loss level without reaching the order, we recommend cancelling the order: the market has undergone internal changes which were not taken into account.
التحليل الأساسي لـ الفوركس - USD/JPY
Japan’s producer prices inflation rose in November. Will the USDJPY price rebounding reverse?
Japan’s producer prices inflation rose in November: the Bank of Japan reported Japan's Producer Price Index (PPI) growth ticked up to 3.7% over year in November after 3.6% growth in October, when a decline to 3.4% rate was expected. At the same time the survey of large manufacturers results revealed that business sentiment improved as indicated by the rise of BSI (Business Survey Index) Manufacturing Index to 6.3 in current quarter from 4.5 in the past quarter. Higher than expected Japan’s producer prices inflation and business optimism are bullish for yen and bearish for USDJPY currency pair. However, the current setup is bullish for the currency pair.
استكشف
شروط التداول لدينا
- فروق الأسعار من 0.0 نقطة
- أكثر من 30,000 أداة تداول
- التنفيذ الفوري
هل أنت مستعد للتداول؟
فتح حساب :تنبيه
يحمل هذا الموجز طابعاً إعلامياً و تعليمياً و تنشر بالمجان . تأتي معظم البيانات المدرجة في الموجز من المصادر العامة معترفة أكثر و أقل موثوقية . مع ذلك ، لا يوجد تأكيد على أن المعلومات المشارة إليها كاملة و دقيقة . لا يتم تحديث الموجز . معظم المعلومات في كل موجز ، تتضمن الرأي و المؤشرات و الرسوم البيانية و أي شيئ اخر وتقدم فقط لأغراض التعريف وليس المشورة المالية أو توصية . لا يمكن اعتبار النص باكماله أو أي جزء منه و أيضاً الرسوم البيانية كعرض لقيام بصفقة بأي اداة . آي إف سي ماركيتس وموظفيها ليست مسؤولة تحت أي ظرف من الظروف عن أي إجراء يتم اتخاذه من قبل شخص آخر أثناء أو بعد قراءة نظرة عامة .

