- Education
- Forex Technical Analysis
- Basic Concepts
- Support and Resistance
Forex Support and Resistance - Support and Resistance Trading
What is Support and Resistance
In technical analysis the lows and highs of the trend are identified by their appropriate names, which are support and resistance levels respectively. These levels are the areas where most traders are willing either to buy or sell an asset.
Support level indicates the area where the buying interest is high and exceeds the selling pressure. At this level the price is considered very attractive for taking long positions and most traders choose to buy an asset when the price approaches a support level.
Resistance level represents the area where the selling interest is high and exceeds the buying pressure. Traders are willing to take short positions and sell an asset when the price approaches this area.
How to Draw Support and Resistance Lines
Support and resistance levels form an essential part of technical analysis used to identify the trend and make trading decisions. They test, as well as confirm trends and should be applied by every trader who uses technical analysis.
Support level is marked by a line which connects previous lows. Depending on the primary trend (prevailing direction of price movements) it can be marked either by a sloping line or a horizontal line.
- In an upward trend the trendline connecting the lows is considered a support with positive slope.
- In a sideways trend the lower trendline is considered a horizontal support.
Resistance level is marked by a line connecting previous highs. Depending on the primary trend a resistance level can also be marked either by a sloping line or a horizontal line.
- In a downward trend the trendline connecting the highs is considered a resistance with negative slope.
- In a sideways trend the upper trendline is considered a horizontal resistance.

For identifying an uptrend each successive support level should be higher than the preceding one and each successive resistance level should be higher than the one preceding it. Otherwise, for instance, when the support level falls down to the previous low, this indicates that either the uptrend comes to an end or at least it changes into a sideways trend.
Conversely, for identifying a downtrend each successive support level should be lower than the previous one and each successive resistance should be lower than the previous one. When a support level comes higher than the previous one, this signals a change in the existing trend.
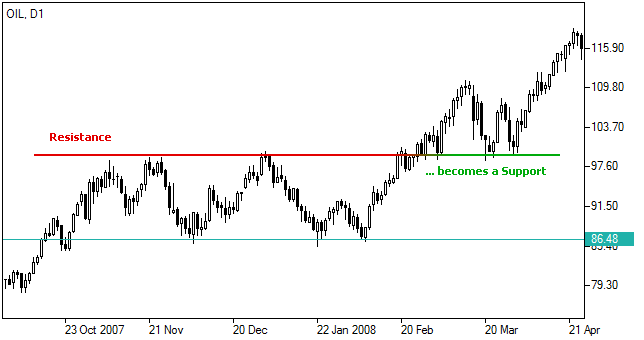
An uptrend is inclined to reverse into a downtrend once the successive higher highs and higher lows change into successive lower highs and lower lows. And conversely, a downtrend can reverse into an uptrend when the lower highs and lower lows turn into successive higher highs and higher lows. In other words, a resistance level becomes a support level, and a support level becomes a resistance level.
This kind of reversal at support and resistance levels in technical analysis is referred to as “rally”, “correction” or “trend reversal”.
- In case a support level is broken below (plus certain deviation is possible), investors may assume that the price will keep on falling. The former support becomes a new resistance level which is expected to hold rallies.
- In case a resistance level is broken above (plus certain deviation is possible), investors may assume that the price will keep on growing. The former resistance becomes a new support level which is expected to hold declines.
The trend is expected to continue as long as the asset price remains between support and resistance levels.
Support and Resistance Trading Strategy
The rationale of support level is that as the price gets closer to this area, buyers see a better deal and are willing to buy, while sellers see a worse deal and are less likely to sell. However, support cannot always hold prices. And when prices break below the support level this indicates that sellers may have a good opportunity to sell the asset.
On the other hand, the main premise behind resistance is that as the price gets closer to the resistance level sellers get more willing to sell an asset, while buyers will be less inclined to buy. A break above the resistance level indicates an increased willingness to buy.
A reversal between support and resistance levels can be either a positive or a negative change against the prevailing trend. It is crucial for analysts and market participants, because depending on the signals of these patterns they adopt a trading strategy on the same security.

Not sure about your Forex skills level?
Take a Test and We Will Help You With The Rest
How to use Support and Resistance in trading platform
You can see the graphical object on the price chart by downloading one of the trading terminals offered by IFC Markets.


