- Education
- Forex Technical Analysis
- Technical Indicators
- Oscillators
- Percentage Price Oscillator
Percentage Price Oscillator: Definition, Formula and How to Use
The Percentage Price Oscillator (PPO) is a widely used technical analysis tool that helps traders assess price momentum and identify potential trading opportunities. In this article, we will explore the PPO indicator in an easy-to-understand language. We will cover the following key topics:
- Percentage Price Oscillator Formula: We will explain the formula used to calculate the PPO, which involves comparing two moving averages and expressing the difference as a percentage. Understanding the formula will help you grasp the underlying calculations and interpretation of the indicator.
- PPO Calculation: We will dive into the step-by-step process of calculating the PPO. This will involve selecting appropriate moving average periods and interpreting the resulting values. By understanding the calculation, you will be able to apply the PPO effectively in your trading analysis.
- How to Use the Percentage Price Oscillator: Here, we will discuss practical ways to utilize the PPO indicator in your trading decisions. We will cover various techniques such as identifying trend reversals, assessing overbought or oversold conditions, and spotting divergences between the PPO line and price movements. By learning how to use the PPO, you will gain valuable insights into potential trading opportunities.
Throughout the article, we will provide examples and illustrations to help you visualize the concepts and application of the PPO indicator. We will also highlight important considerations and potential limitations of the indicator to ensure you have a well-rounded understanding.
Whether you are a beginner or an experienced trader, understanding the PPO indicator can enhance your technical analysis skills and aid in making informed trading decisions.
Let’s get started!
What is PPO Indicator
The Percentage Price Oscillator (PPO) is a technical analysis tool that traders use to assess the momentum and direction of price movements in financial markets. It is a variation of the popular MACD indicator, designed to provide a clearer understanding of price trends and potential trading opportunities.
The PPO calculates the difference between two moving averages of the price data and presents it as a percentage. It compares the short-term and long-term moving averages to gauge the strength and magnitude of price changes relative to the overall trend.
Traders use the PPO in several ways. Firstly, they look for the PPO line to cross above or below the zero line. When the PPO line crosses above zero, it suggests that the shorter-term moving average is gaining momentum and there may be a bullish trend forming. Vice versa, if the PPO line crosses below zero, it indicates that the shorter-term moving average is losing momentum, potentially signaling a bearish trend.
Additionally, traders analyze the divergence between the PPO line and the price chart. If the PPO line is moving in the opposite direction to the price chart, it may indicate a potential reversal or divergence in price momentum. This can be a useful tool for identifying potential buying or selling opportunities.
PPO can also help traders spot overbought or oversold conditions. When the PPO line reaches extreme values, such as high positive or negative percentages, it suggests that the price may have deviated significantly from the average and a reversal or correction may be imminent.
It's important to note that the PPO, like any technical indicator, has limitations and should be used in conjunction with other analysis tools and indicators to confirm trading decisions. Additionally, different market conditions may require adjustments to the parameters of the PPO to suit the specific asset or timeframe being analyzed.
Percentage Price Oscillator Formula
The Percentage Price Oscillator (PPO) formula involves comparing two moving averages of the price data and expressing the difference as a percentage.
Here's the formula for calculating the PPO:
PPO = ((Short-term EMA - Long-term EMA) / Long-term EMA) * 100
Variables:
- PPO: The resulting value of the Percentage Price Oscillator, expressed as a percentage.
- Short-term EMA: The exponential moving average calculated based on a selected short-term period. It emphasizes recent prices and is more responsive to short-term price changes.
- Long-term EMA: The exponential moving average calculated based on a chosen long-term period. It provides a broader view of the price trend and is less sensitive to short-term fluctuations.
By using this formula, the PPO allows traders to assess the relative strength and momentum of price movements based on the difference between the short-term and long-term EMAs.
PPO Calculation
Let's break down the components of the formula:
- Short-term EMA: This represents the short-term exponential moving average, which is calculated based on a selected period of price data. The exponential moving average gives more weight to recent prices, making it responsive to short-term price changes.
- Long-term EMA: This denotes the long-term exponential moving average, calculated based on a longer period of price data. The long-term moving average provides a broader view of the price trend.
- Difference between Short-term EMA and Long-term EMA: Subtracting the long-term EMA from the short-term EMA gives us the numerical difference between the two moving averages.
- Divide by Long-term EMA: This difference is then divided by the long-term EMA to normalize the value and express it as a percentage.
- Multiply by 100: Finally, the resulting value is multiplied by 100 to convert it into a percentage.
By calculating the PPO using this formula, we obtain a percentage value that represents the difference between the short-term and long-term moving averages in relation to the long-term average. This percentage helps traders gauge the momentum and strength of price movements, aiding in trend identification and potential trading signals.
Remember that the specific period lengths for the short-term and long-term moving averages can vary based on individual preferences and market conditions. Additionally, it's important to note that different trading platforms or charting tools may offer variations in the PPO calculation, such as using different types of moving averages or applying additional smoothing techniques.
How to Use Percentage Price Oscillator
Using the Percentage Price Oscillator (PPO) involves several key steps to analyze price momentum and identify potential trading opportunities. Here's a guide on how to use the PPO effectively:
- Applying the PPO
- PPO Line Crosses Zero
- Bullish and Bearish Divergences
- Overbought and Oversold Conditions
- Confirmation with Other Indicators
Applying the PPO
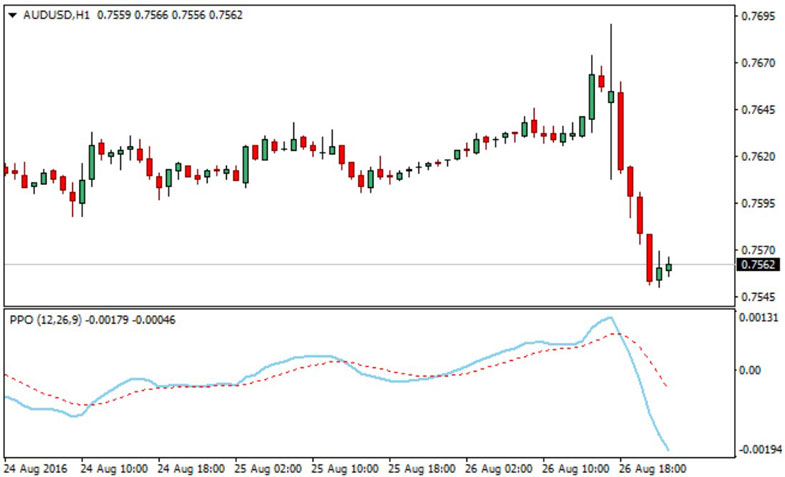
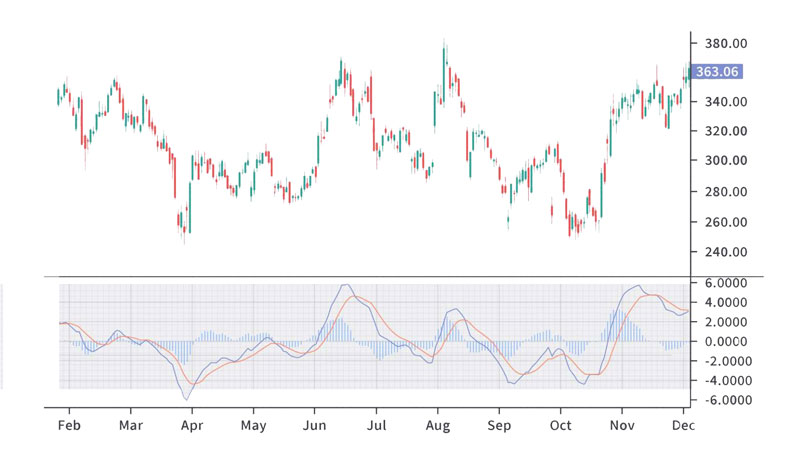
Start by plotting the PPO indicator on your price chart. The PPO line is typically displayed below the price chart, with a zero line running across the middle. This visual representation helps you assess the PPO values and their relationship to the price movements.
PPO Line Crosses Zero
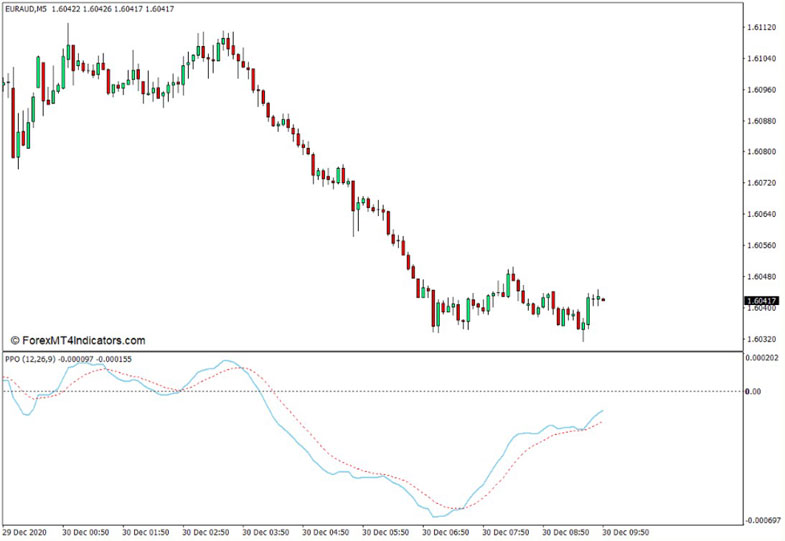
Pay attention to the PPO line crossing above or below the zero line. When the PPO line crosses above zero, it indicates that the short-term EMA is gaining momentum relative to the long-term EMA. This suggests a potential bullish trend. Conversely, when the PPO line crosses below zero, it indicates a loss of momentum in the short-term EMA, possibly signaling a bearish trend.
Bullish and Bearish Divergences
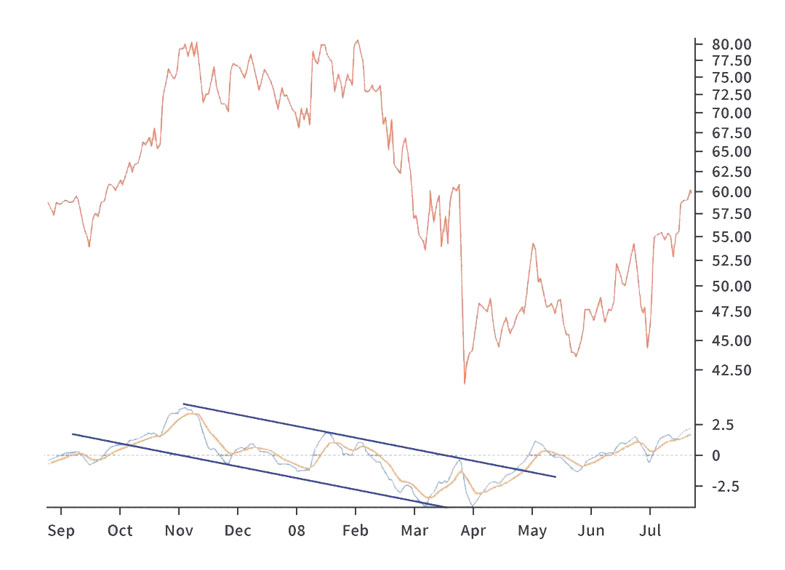
Look for divergences between the PPO line and the price chart. If the PPO line moves in the opposite direction to the price chart, it could signify a potential reversal or divergence in price momentum. For example, if the price is making higher highs while the PPO line is making lower highs, it may indicate a bearish divergence. Conversely, a bullish divergence occurs when the price makes lower lows while the PPO line makes higher lows. These divergences can provide valuable trading signals.
Overbought and Oversold Conditions
Monitor extreme values on the PPO line. When the PPO line reaches high positive percentages, it suggests an overbought condition, indicating that the price has deviated significantly above the average. This may indicate a potential reversal or correction. Conversely, when the PPO line reaches high negative percentages, it suggests an oversold condition, indicating the price has fallen well below the average. This can indicate a potential buying opportunity.
Confirmation with Other Indicators
Combine the analysis of the PPO with other technical indicators or analysis techniques to strengthen your trading decisions. Consider using tools such as support and resistance levels, trend lines, or volume indicators to confirm the signals generated by the PPO.
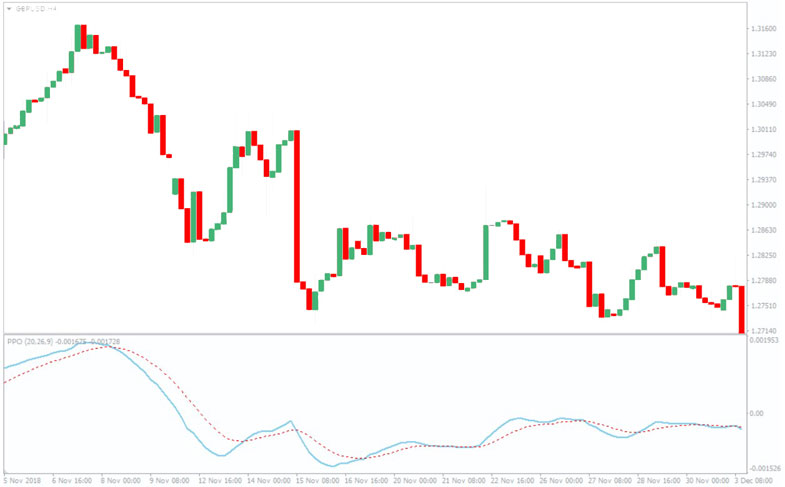
Needless to mention that this indicator, the same as others, isn't bulletproof and to reach a more precise decision it is best to combine with other factors.
Bottom line on Percentage Price Oscillator
In conclusion, the PPO indicator offers valuable insights into price momentum, trend reversals, and overbought/oversold conditions. But also PPO indicator has limitations as a lagging indicator and can generate false signals in certain market conditions.
Anyway, I would like to end this article by mentioning PPO indicator’s strengths and weaknesses. By being aware of its strengths and weaknesses, traders can utilize the PPO effectively as part of a comprehensive trading strategy.
Understanding these aspects can help traders make informed decisions. Here's a breakdown of the strengths and weaknesses of the PPO:
Strengths:
Momentum Assessment: The PPO allows traders to assess price momentum by comparing short-term and long-term moving averages. This helps identify potential trends and the strength of price movements.
Trend Reversal Signals: The PPO can generate signals for potential trend reversals. Crossings above or below the zero line can indicate shifts in market sentiment and provide early indications of trend changes.
Divergence Identification: The PPO helps identify divergences between the indicator and price movements. These divergences can signal potential reversals or changes in momentum, offering valuable trading opportunities.
Overbought/Oversold Conditions: The PPO can indicate overbought or oversold conditions in the market. Extreme positive or negative values on the PPO line may suggest price levels that have deviated significantly from the average, potentially leading to reversals or corrections.
Weaknesses:
Lagging Indicator: Like most trend-following indicators, the PPO is a lagging indicator. It reacts to price movements that have already occurred, which means it may not provide timely signals for quick or short-term trades.
Whipsaw Movements: During choppy or sideways markets, the PPO can generate false or conflicting signals. Traders should exercise caution and consider additional confirmation tools to filter out noise and false signals.
Parameter Sensitivity: The effectiveness of the PPO depends on selecting appropriate parameter values, such as the short-term and long-term periods. Different assets and timeframes may require adjustments to these parameters, making it crucial to optimize them for accurate analysis.
Market Dependence: The PPO's performance can vary across different market conditions. It may work well in trending markets but provide less reliable signals in ranging or volatile markets. Traders should consider using the PPO alongside other indicators to gain a comprehensive view.
Forex Indicators FAQ
What is a Forex Indicator?
Forex technical analysis indicators are regularly used by traders to predict price movements in the Foreign Exchange market and thus increase the likelihood of making money in the Forex market. Forex indicators actually take into account the price and volume of a particular trading instrument for further market forecasting.
What are the Best Technical Indicators?
Technical analysis, which is often included in various trading strategies, cannot be considered separately from technical indicators. Some indicators are rarely used, while others are almost irreplaceable for many traders. We highlighted 5 the most popular technical analysis indicators: Moving average (MA), Exponential moving average (EMA), Stochastic oscillator, Bollinger bands, Moving average convergence divergence (MACD).
How to Use Technical Indicators?
Trading strategies usually require multiple technical analysis indicators to increase forecast accuracy. Lagging technical indicators show past trends, while leading indicators predict upcoming moves. When selecting trading indicators, also consider different types of charting tools, such as volume, momentum, volatility and trend indicators.
Do Indicators Work in Forex?
There are 2 types of indicators: lagging and leading. Lagging indicators base on past movements and market reversals, and are more effective when markets are trending strongly. Leading indicators try to predict the price moves and reversals in the future, they are used commonly in range trading, and since they produce many false signals, they are not suitable for trend trading.

