- Education
- Forex Technical Analysis
- Technical Indicators
- Trend Indicators
- Smoothed Moving Average
Smoothed Moving Average: Formula, Settings and How to Use it
Smoothed moving averages (SMAs) are a type of technical analysis tool that traders use to identify market trends, support and resistance levels, and potential entry and exit points. SMAs are calculated by taking the average of a certain number of data points, with more weight given to recent data. This helps to reduce the impact of short-term price fluctuations and make the SMA more responsive to recent trends.
SMAs can be used in a variety of trading strategies, such as using SMA crossovers to identify buy and sell signals or as a trailing stop loss. However, SMAs are not without their limitations. One limitation is that it can be difficult to find the optimal time period for calculation. Another limitation is that SMAs can produce false signals in volatile markets.
Despite these limitations, SMAs can be a valuable tool for traders. By understanding the advantages and disadvantages of SMAs, traders can choose the indicator that best suits their trading strategy and investment goals.

Here are some of the key points to remember about SMAs:
- SMAs are calculated by taking the average of a certain number of data points, with more weight given to recent data.
- SMAs can be used to identify market trends, support and resistance levels, and potential entry and exit points.
- SMAs can be used in a variety of trading strategies, but they are not without their limitations.
- It is important to understand the advantages and disadvantages of SMAs before using them.
In this article we are going to learn Smoothed moving averages at the end of it you will be equipped with the knowledge to leverage the Smoothed moving averages (SMA) effectively.
Key points to be covered in the article:
- Understanding the Smoothed Moving Average (SMA):
- Calculation of the SMA:
- Interpreting the SMA Indicator:
- Practical Applications of the SMA Indicator:
- Combining the EMA Indicator with Other Tools
What is Smoothed Moving Average
The Smoothed Moving Average (SMA) is a tool that traders and investors use to understand price trends in financial markets. It's an improved version of the regular moving average indicator, designed to give a clearer view of price movements over a specific time period.
The SMA calculates the average price of an asset over a certain period, usually using closing prices. Then, it smooths out the data by giving more importance to recent prices. This smoothening process helps remove short-term price fluctuations and focuses on the overall trend of the asset.
Traders use the SMA in different ways. Firstly, it helps them figure out the direction of the market trend. If the SMA is going up, it means there's an upward trend, and if it's going down, there's a downward trend. By looking at the slope of the SMA, traders can also get an idea of how strong and fast the trend is moving.
Moreover, the SMA can give signals to buy or sell an asset. Traders pay attention to when different SMA periods cross each other, like the 50-day SMA crossing the 200-day SMA. If the shorter-term SMA crosses above the longer-term SMA, it may suggest a good time to buy.
On the other hand, if the crossover happens in the opposite direction, it could be a sign to sell. The smoothing effect of the SMA helps remove short-term noise from the market, allowing traders to focus on the bigger picture. Instead of getting distracted by temporary price changes, they can concentrate on the overall trend and make better-informed decisions.
Keep in mind though that the SMA is just one tool among many, and it's not perfect. Traders should combine it with other analysis tools to get a more complete understanding. Also, different assets and timeframes may require adjustments to the SMA parameters to fit the specific situation.
Smoothed Moving Average Formula
SMA = (Closing Price * Smoothing Factor) + (Previous SMA * (1 - Smoothing Factor))
Variables:
- SMA: Smoothed Moving Average value for a particular period.
- Closing Price: The closing price of the asset for the current period.
- Smoothing Factor: The smoothing factor determines the weight given to each price in the series. It is calculated using the formula: Smoothing Factor = 2 / (Selected period + 1) The selected period refers to the time frame or number of data points used in the calculation. For example, if you choose a 10-day SMA, the selected period is 10.
- Previous SMA: The Smoothed Moving Average value for the previous period.
To calculate the SMA, you start with an initial Simple Moving Average (SMA) for the selected period. Then, for each subsequent period, you apply the smoothing factor to the current closing price and the previous SMA value. This recursive calculation allows you to obtain the Smoothed Moving Average values for each period.
Smoothed Moving Average Calculation
The formula for calculating the Smoothed Moving Average (SMA) involves a series of steps. Here's a breakdown of the formula:
- Determine the period length: Decide on the time frame or number of data points you want to include in the calculation. For example, if you choose a 10-day SMA, you will use the prices of the last 10 days.
- Calculate the Simple Moving Average (SMA): Add up the closing prices for the selected period and divide the sum by the number of data points. This gives you the Simple Moving Average for the initial period.
- Calculate the smoothing factor: The smoothing factor determines the weight given to each price in the series. It is calculated using the formula: Smoothing Factor = 2 / (Selected period + 1)
- Calculate the Smoothed Moving Average: Starting from the second period onwards, you apply the smoothing factor to the current closing price and the previous SMA. The formula is: SMA = (Closing Price * Smoothing Factor) + (Previous SMA * (1 - Smoothing Factor))
By repeating this calculation for each period, you obtain the Smoothed Moving Average values.
It's important to note that there are variations in the formula depending on the specific implementation or trading platform. Some platforms may use different default smoothing factors or offer adjustable parameters to customize the SMA calculation according to individual preferences.
In summary, the Smoothed Moving Average formula involves calculating the Simple Moving Average for an initial period, determining the smoothing factor, and then applying it to subsequent periods to calculate the Smoothed Moving Average values.
How to Use Smoothed Moving Average
To use the Smoothed Moving Average (SMA) indicator effectively, here are some steps and examples:
- Determine the time frame and parameters
- Plot the SMA on a Price Chart
- Identify the Direction of the Trend
- Look for Crossovers
- Confirm with other indicators
1. Determine the Time Frame and Parameters
Decide on the period length for the SMA and choose suitable parameters. For instance, you might select a 20-day SMA with a smoothing factor of 0.1.

2. Plot the SMA on a Price Chart
Plot the SMA line on a price chart of the asset you are analyzing. The SMA line will smooth out the price data, providing a clearer view of the trend.

3. Identify the Direction of the Trend
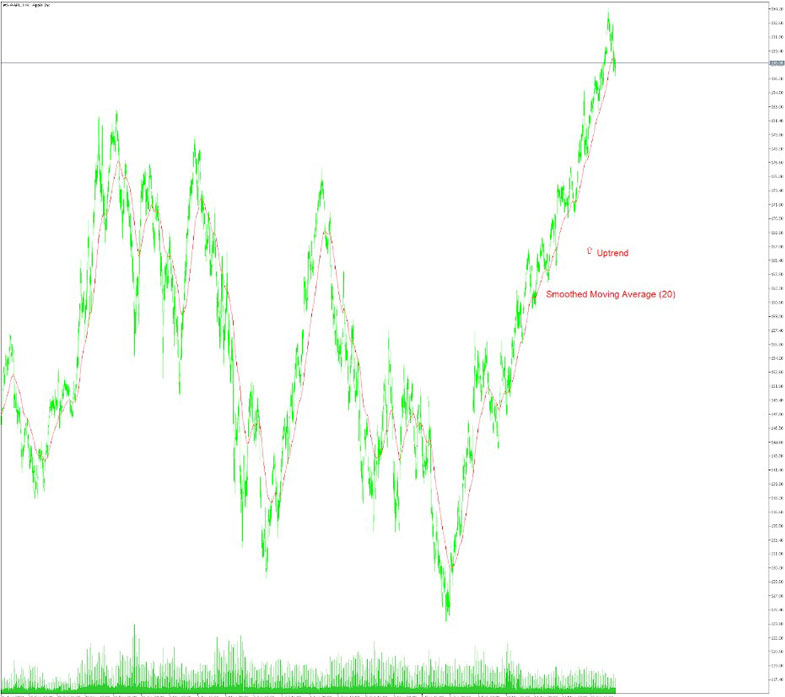
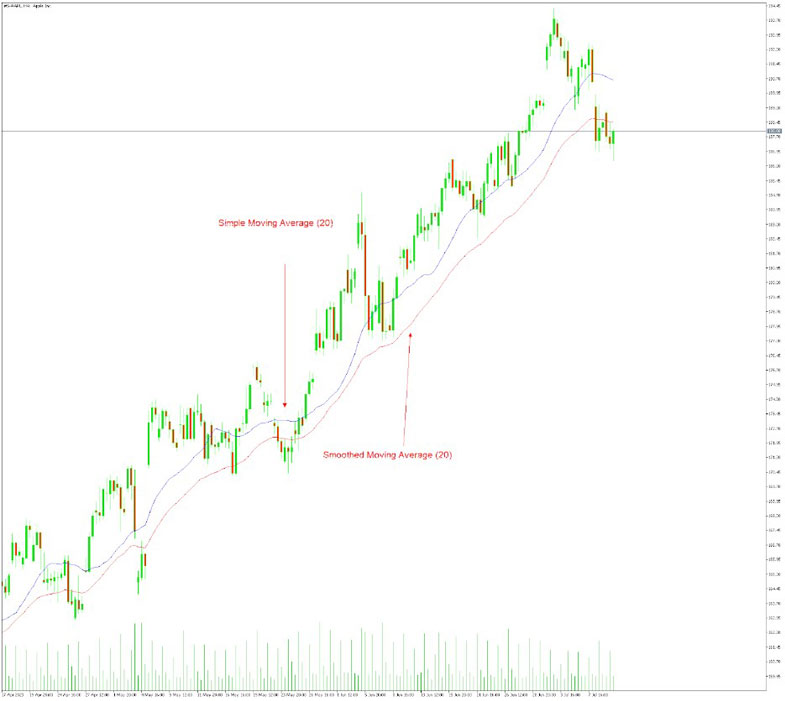
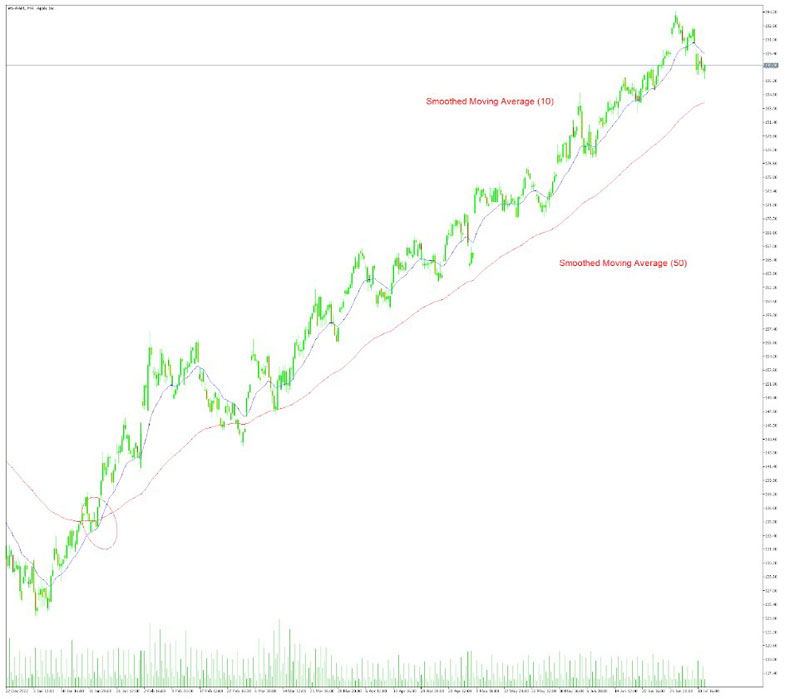
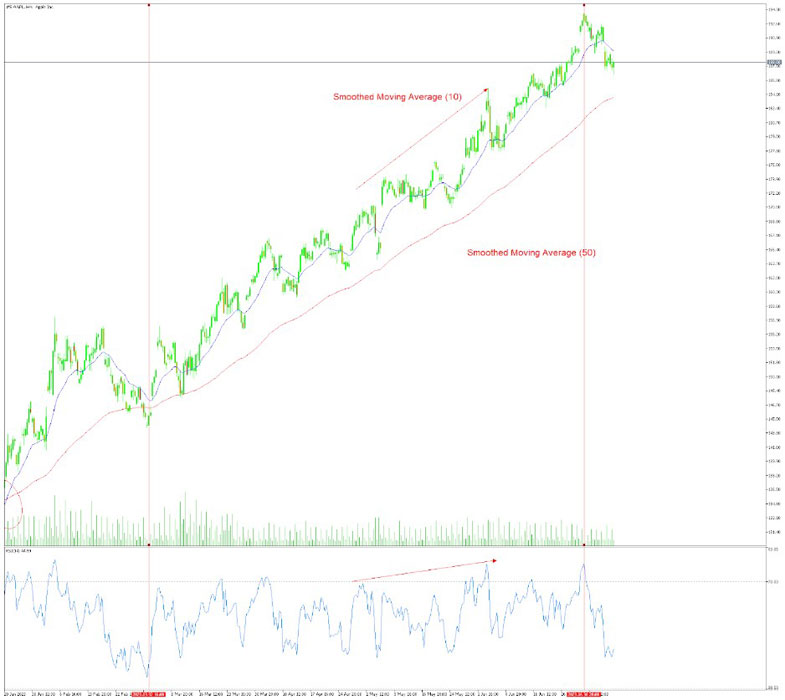
Observe the slope and direction of the SMA line. If the SMA is moving upward, it indicates an uptrend, while a downward sloping SMA suggests a downtrend. This information helps you understand the general market sentiment. You can clearly see on the charts above the uptrend of Apple stock price.
4. Look for Crossovers
Pay attention to crossover points between different SMA periods. For example, you can observe when the 10-day SMA crosses above the 50-day SMA. If the shorter-term SMA crosses above the longer-term SMA, it may signal a bullish trend and a potential buying opportunity. Conversely, if the shorter-term SMA crosses below the longer-term SMA, it may indicate a bearish trend and a possible selling opportunity.

5. Confirm with Other Indicators
To validate the signals generated by the SMA, consider using other technical indicators or analysis techniques. This can include tools like support and resistance levels, volume indicators, or additional moving averages. By combining multiple indicators, you can gain a more comprehensive understanding of the market.

SMMA is a useful indicator for identifying trends, predicting future price movements, and finding entry and exit points for trades. But, it is important to remember that SMMA is not a perfect indicator and should be used in conjunction with other technical analysis tools.
Bottom Line on Smoothed Moving Average
In conclusion we would like to end this article witht key points for SMMA:
Smoothing Effect: The SMA smoothes out price data by applying a weighted average that reduces short-term market noise. This helps traders focus on the overall trend rather than temporary price fluctuations.
Trend Identification: The slope and direction of the SMA line provide insights into the market trend. An upward sloping SMA suggests an uptrend, while a downward sloping SMA indicates a downtrend.
Crossover Signals: Traders often look for crossovers between different SMA periods. When the shorter-term SMA crosses above the longer-term SMA, it may signal a bullish trend and a potential buying opportunity. Conversely, a crossover in the opposite direction may indicate a bearish trend and a possible selling opportunity.
Confirmation with Other Indicators: It's important to use the SMA in conjunction with other technical indicators and analysis tools to validate signals and make well-informed trading decisions. Consider using additional indicators such as support and resistance levels, volume analysis, or other moving averages.
Customization: The SMA can be customized by selecting different time periods and adjusting the smoothing factor. Different assets and market conditions may require varying parameter choices for optimal results.
Limitations: While the SMA can be a useful tool, it's important to remember that no indicator is foolproof. Traders should consider multiple factors and conduct comprehensive analysis before making trading decisions.
In conclusion, the Smoothed Moving Average is a versatile indicator that helps traders identify trends, filter out market noise, and generate trading signals. By providing a smoother representation of price movements, it assists in making informed trading decisions.
However, it should be used alongside other indicators and analysis techniques to achieve a well-rounded understanding of the market.
Forex Indicators FAQ
What is a Forex Indicator?
Forex technical analysis indicators are regularly used by traders to predict price movements in the Foreign Exchange market and thus increase the likelihood of making money in the Forex market. Forex indicators actually take into account the price and volume of a particular trading instrument for further market forecasting.
What are the Best Technical Indicators?
Technical analysis, which is often included in various trading strategies, cannot be considered separately from technical indicators. Some indicators are rarely used, while others are almost irreplaceable for many traders. We highlighted 5 the most popular technical analysis indicators: Moving average (MA), Exponential moving average (EMA), Stochastic oscillator, Bollinger bands, Moving average convergence divergence (MACD).
How to Use Technical Indicators?
Trading strategies usually require multiple technical analysis indicators to increase forecast accuracy. Lagging technical indicators show past trends, while leading indicators predict upcoming moves. When selecting trading indicators, also consider different types of charting tools, such as volume, momentum, volatility and trend indicators.
Do Indicators Work in Forex?
There are 2 types of indicators: lagging and leading. Lagging indicators base on past movements and market reversals, and are more effective when markets are trending strongly. Leading indicators try to predict the price moves and reversals in the future, they are used commonly in range trading, and since they produce many false signals, they are not suitable for trend trading.

