- Education
- Forex Technical Analysis
- Technical Indicators
- Oscillators
- Bollinger Bands
Bollinger Bands Explained
What are Bollinger Bands
Bollinger Bands are among the most reliable trading indicators that traders can choose from. In contrast to most other indicators, Bollinger Bands indicator is a non-static, but dynamic indicator which means that it adapts to new market conditions, changing its shape based on recent price action and measuring momentum and volatility. Thus, Bollinger Bands have benefits over other standard indicators.
Traders can use the Bollinger Bands to analyze the strength of trends and get a lot of important information this way.
So, what is Bollinger Bands indicator?
The Bollinger Bands indicator displays the current market volatility changes, confirms the direction, warns of a possible continuation or break-out of the trend, periods of consolidation, increasing volatility for break-outs as well as pinpoints local highs and lows.
How to Use Bollinger Bands
The indicator consists of the three moving averages:
- Upper band - 20-day simple moving average (SMA) plus double standard price deviation.
- Middle band - 20-day SMA.
- Lower band - 20-day SMA minus double standard price deviation.
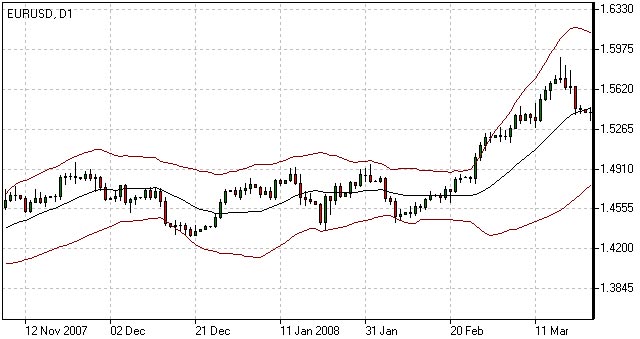
The increasing distance between the upper and the lower bands while volatility is growing, suggests of a price developing in a trend which direction correlates with the direction of the Middle line. In contrast to the above, at times of decreasing volatility when the bands are closing in, we should be expecting the price to move sidewards in a range.
The price moving outside the Bands may indicate either the trend’s continuation (when the bands are floating apart as the volatility increases) or the U-turn of the trend if the initial movement is exhausted. Either way each of the scenarios must be confirmed by other indicators such as RSI, ADX or MACD.
Anyhow the price crossing of the Middle line from below or above may be interpreted as a signal to buy or to sell respectively.

Bollinger Bands
Bollinger Bands Trading Strategy
Bollinger Bands trading strategy aims to profit from oversold or overbought conditions on the market. Prices are considered overextended on the upside when they touch the upper band (overbought). They are overextended on the downside, when they touch the lower band (oversold). This strategy is used as an immediate signal to buy or sell the security. The usage of upper and lower bands as price targets is referred to as the simplest way of using Bollinger Bands strategy. If prices cross below the average, the lower band becomes the lower price target. If the prices cross above the same average, the upper band identifies the upper price target.
In a Bollinger Band trading system an uptrend is shown by prices fluctuating between upper and middle bands. In such cases if prices cross below the middle band, this warns of a trend reversal to the downside indicating a sell signal.
In a downtrend, prices fluctuate between middle and lower bands, and the price crossing above the middle band warns of a trend reversal to the upside, indicating a buy signal.
Bollinger Bands Formula (Calculation)
The middle line of the indicator is calculated as the simple moving average with a 20-day period, and for the calculation of the upper and lower lines, the standard deviation is added to or subtracted from the moving average.
The middle line (ML) is a regular Moving Average:
ML = SUM [CLOSE, N]/NThe top line (TL) is ML a deviation (D) higher:
TL = ML + (D*StdDev)The bottom line (BL) is ML a deviation (D) lower.
BL = ML — (D*StdDev)
Where: N — number of periods used in calculation; ML — Simple Moving Average; StdDev — Standard Deviation.
How to use Bollinger Bands in trading platform
Forex Indicators FAQ
What is a Forex Indicator?
Forex technical analysis indicators are regularly used by traders to predict price movements in the Foreign Exchange market and thus increase the likelihood of making money in the Forex market. Forex indicators actually take into account the price and volume of a particular trading instrument for further market forecasting.
What are the Best Technical Indicators?
Technical analysis, which is often included in various trading strategies, cannot be considered separately from technical indicators. Some indicators are rarely used, while others are almost irreplaceable for many traders. We highlighted 5 the most popular technical analysis indicators: Moving average (MA), Exponential moving average (EMA), Stochastic oscillator, Bollinger bands, Moving average convergence divergence (MACD).
How to Use Technical Indicators?
Trading strategies usually require multiple technical analysis indicators to increase forecast accuracy. Lagging technical indicators show past trends, while leading indicators predict upcoming moves. When selecting trading indicators, also consider different types of charting tools, such as volume, momentum, volatility and trend indicators.
Do Indicators Work in Forex?
There are 2 types of indicators: lagging and leading. Lagging indicators base on past movements and market reversals, and are more effective when markets are trending strongly. Leading indicators try to predict the price moves and reversals in the future, they are used commonly in range trading, and since they produce many false signals, they are not suitable for trend trading.
Use indicators after downloading one of the trading platforms, offered by IFC Markets.

Not sure about your Forex skills level?
Take a Test and We Will Help You With The Rest


